
Androidでチャート(グラフ)を描画する方法を紹介します。なるべく簡単にしたサンプルコードをKotlinで作成しましたので参考になればと思います。
チャート(グラフ)を描画する「MPAndroidChart」とは?
今回はMPAndroidChartを使ってチャート描画をします。
MPAndroidchartは、Androidでグラフを描画するためのオープンソースライブラリ(Philip Jahoda氏が作成)です。
他にも描画ライブラリはあるようですが、広く使われているのがMPAndroidChartのようです。
チャート描画の準備(MPAndroidChartの導入)
コードを書く前に、MPAndroidChart導入のために以下2つの準備をします。
settings.gradle(Project Settings)の編集
settings.gradle(Project Settings)に、「maven { url ‘https://jitpack.io’ }」を追記します。
// --- 略 ---
dependencyResolutionManagement {
    repositoriesMode.set(RepositoriesMode.FAIL_ON_PROJECT_REPOS)
    repositories {
        google()
        mavenCentral()
        maven { url 'https://jitpack.io' }
    }
}
// --- 略 ---
build.grade(Module)の編集
dependenciesに以下を追記します。
dependencies {
    // --- 略 ---
    implementation 'com.github.PhilJay:MPAndroidChart:v3.1.0'
}
チャート描画サンプル
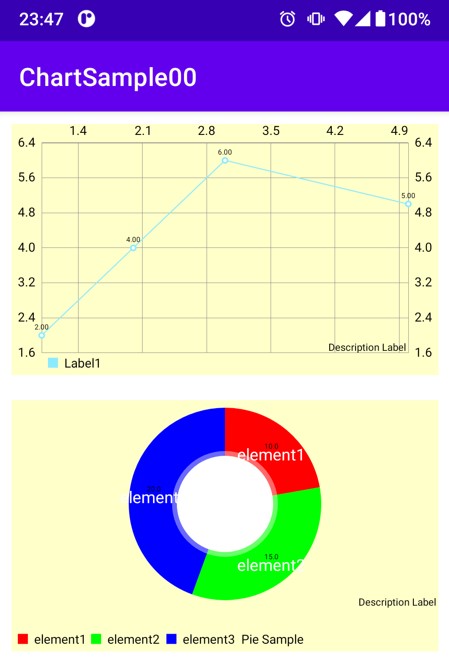
以下のようなサンプルを作成しました(線グラフと円グラフ)。
XML
チャート領域を2つ配置。
<LinearLayout xmlns:android="http://schemas.android.com/apk/res/android"
    xmlns:app="http://schemas.android.com/apk/res-auto"
    xmlns:tools="http://schemas.android.com/tools"
    android:layout_width="match_parent"
    android:layout_height="match_parent"
    android:orientation="vertical"
    tools:context=".MainActivity">

    <!-- Chart:線グラフ -->
    <com.github.mikephil.charting.charts.LineChart
        android:id="@+id/chartLine"
        android:layout_width="match_parent"
        android:layout_height="200dp"
        android:layout_margin="10dp"/>

    <!-- Chart:円グラフ -->
    <com.github.mikephil.charting.charts.PieChart
        android:id="@+id/chartPie"
        android:layout_width="match_parent"
        android:layout_height="200dp"
        android:layout_margin="10dp"/>

</LinearLayout>
Kotlin
XMLとKotlin側の紐づけはbindingを使用しています。
チャートの描画は、以下の手順で行います。
- グラフに描画するデータ群を用意
- DataSetにデータ群を入れる
- DataにDataSetに入れる
- チャートにDataを入れる
package com.example.chartsample00

import android.graphics.Color
import androidx.appcompat.app.AppCompatActivity
import android.os.Bundle
import android.view.View
import android.widget.Toast
import com.example.chartsample00.databinding.ActivityMainBinding
import com.github.mikephil.charting.data.Entry
import com.github.mikephil.charting.data.PieEntry
import com.github.mikephil.charting.data.LineData
import com.github.mikephil.charting.data.LineDataSet
import com.github.mikephil.charting.data.PieData
import com.github.mikephil.charting.data.PieDataSet

class MainActivity : AppCompatActivity() {

    private lateinit var binding : ActivityMainBinding

    override fun onCreate(savedInstanceState: Bundle?) {
        super.onCreate(savedInstanceState)

        binding = ActivityMainBinding.inflate(layoutInflater)
        val view = binding.root
        setContentView(view)

        // チャート表示1:線グラフ-------------------------------------------
        // 手順:①データを用意 ②DataSetにデータ群を入れる ③DataにDatasetを追加 ④チャートのデータにDataを入れる

        //①
        val inputs1 = ArrayList<com.github.mikephil.charting.data.Entry>()
        inputs1.add(Entry(1f,2f))
        inputs1.add(Entry(2f,4f))
        inputs1.add(Entry(3f,6f))
        inputs1.add(Entry(5f,5f))
        //②
        val dataSet1 = LineDataSet(inputs1, "Label1")
        //③
        val data1 = LineData(dataSet1)
        //④
        binding.chartLine.data = data1

        // 背景色の変更
        binding.chartLine.setBackgroundColor(Color.rgb(255,255, 200))


        // チャート表示2:円グラフ-------------------------------------------
        // 手順:①データを用意 ②DataSetにデータ群を入れる ③DataにDatasetを追加 ④チャートのデータにDataを入れる

        //①
        val inputs2 = ArrayList<com.github.mikephil.charting.data.PieEntry>()
        inputs2.add(PieEntry(10f,"element1"))
        inputs2.add(PieEntry(15f,"element2"))
        inputs2.add(PieEntry(20f,"element3"))
        //②
        val dataSet2 = PieDataSet(inputs2, "Pie Sample")
        //③
        val data2 = PieData(dataSet2)
        //④
        binding.chartPie.data = data2

        // 背景色の変更
        binding.chartPie.setBackgroundColor(Color.rgb(255,255,200))

    }
}
最後にチャートの背景色を変えていますが、視認性の都合で特に意味はないです。
エラー「Interface Entry does not have constructors」に対処
当初、このエラーが出てデバッグが通りませんでした。
(位置は、32行、52行など)
「インターフェースEntryにコンストラクタがないよ」というエラーです。
開発環境がEntryを別のEntry(インターフェース)と勘違いしているのが原因と思われます。
以下をKotlinのコードに以下を追記してください。
import com.github.mikephil.charting.data.Entry        // ← 線グラフの場合
import com.github.mikephil.charting.data.PieEntry   // ← 円グラフの場合
これで解決するはず。
さいごに
C#でチャートを描画する方法に似ているので、そちらで触ってた方は受け入れやすいと思います。
情報が一瞬で伝わるチャート(グラフ)はやはり便利ですね。少しめんどくさいですが使いこなしたいtところ。
以下は本記事の発展内容。チャートの更新方法。

以下はAndroid関連記事。


コメント
ご指導ありがとうございます。
下記修正を経て、実行に成功しました。
■実行時、エラー発生:
Unresolved reference: databinding
Unresolved reference: ActivityMainBinding
解決策
(1)build.gradle.kts(Module:app)のandroidに下記コード追加
viewBinding {
enable = true
}
(2)パッケージのパスをサンプルコードに合わせて作る
package com.example.chartsample00
import com.example.chartsample00.databinding.ActivityMainBinding
(サンプルコードをそのままファイルにコピーしてもうまくいかなかった。exampleでつまづいた)
■maven { url ‘https://jitpack.io’ }でSyncエラー
Unexpected tokens (use ‘;’ to separate expressions on the same line)
解決策
mavenのurlの指定方法を変更(settings.gradle.kts)
maven { url = uri(“https://jitpack.io”) }